In this tutorial we will install and configure Suricata using a Linux Ubuntu machine. This way, we will use the repository to install Suricata.
Suricata is a system used to detect and prevent intruders. In this way, we can use Suricata to improve the security of our network against attacks that come from within the network or the Internet.
When Suricata works as an Intruder Detector (IDS), it generates alerts that will allow the network administrator to take the necessary measures for the security incident.
However, the Suricata can also be used to prevent intruders from occurring. This is because the Suricata can take actions to counter an attack. As an example, we could have the Suricata blocking an intruder’s IP address.
This tutorial is part of the Suricata Linux Course.
Lesson 1: Install Suricata on Linux
Lesson 3: Suricata Network IPS
Link to the Suricata course on YouTube:
Proposed scenario
Installing Suricata on Ubuntu
As mentioned before, in this tutorial we are going to install Suricata using an Ubuntu machine. For that, we will use the command below to add the Suricata repository to our system.
sudo add-apt-repository ppa:oisf/suricata-stable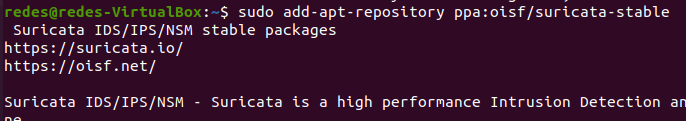
Next, let’s update our repositories, as we’ve just added a new repository.
sudo apt-get updateNow, let’s install Suricata. For this we will use the command below.
sudo apt-get install suricata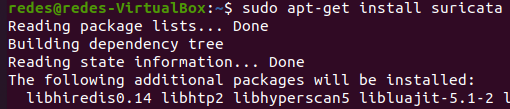
Now let’s enable the Suricata to boot along with the system. This way, Suricata will be enabled every time the computer is restarted. For this, we will use the command below:
sudo systemctl enable suricata.service
Alternative Suricata Installation
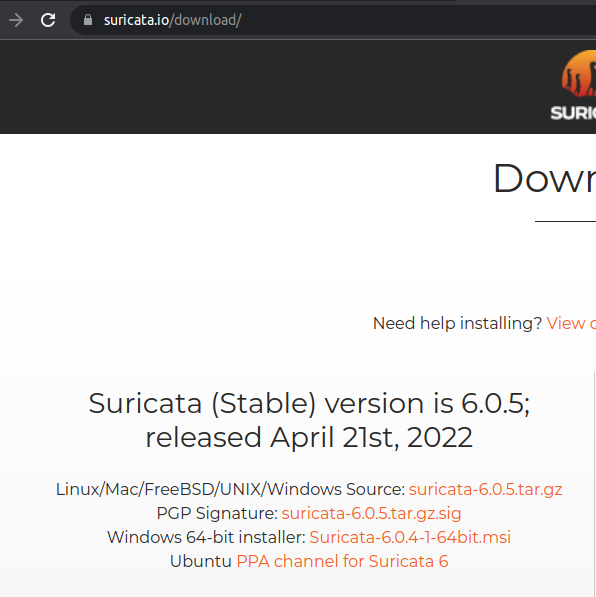
Alternatively, we can install Suricata using the other installation packages that allow Suricata to be installed on Mac. FreeBSD, Unix, and Windows. For this, we need to access the link below and select the package we want to install.
Note – This way of installation can also be interesting if you are using a Linux distribution other than Ubuntu.
Configuring the Suricata
Now that we’ve installed Suricata, let’s make some basic settings for the tool to work properly. For this, we will enter the Suricata configuration directory using the command below.
cd /etc/suricataNext, we can list the files that are inside the Suricata folder. For this we can use the Linux ls command.
lsWe can see in the figure below that there are several files and a folder named rules.

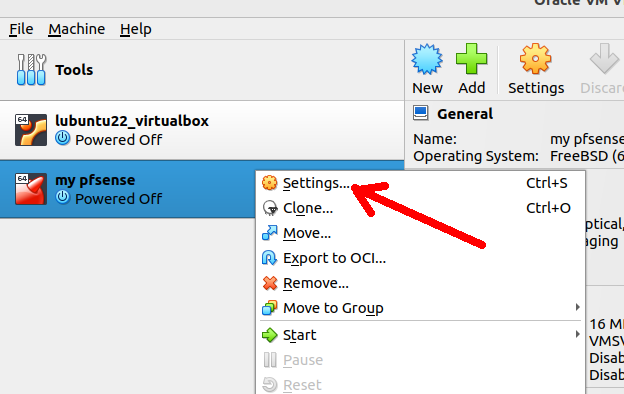
Before proceeding with the configuration. Let’s check which network interface we are going to use Suricata on. In our case, we are using a virtualbox virtual machine. And this virtual machine has two interfaces.
The first interface is in NAT mode and the second interface is in “internal network” mode. In this scenario, we are going to use Suricata in the second interface, that is, the “internal network” interface.
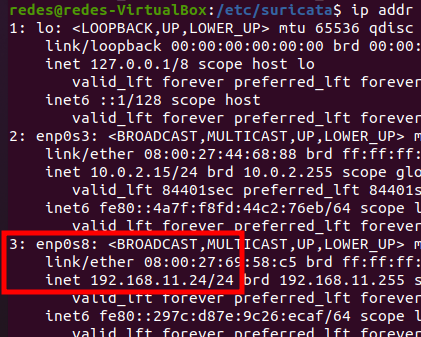
To check the existing interfaces we can use the command below.
ip addrThe figure below shows that our virtual machine has 3 interfaces. However the first interface is loopback so we can disregard it. Thus, the interface that we want to monitor with the Suricata is the third interface “enp0s8” as this is the interface that is in “internal network” mode.
Now, let’s edit the “suricata.yaml” file and indicate the interface that we will monitor. For this, we are going to use the nano editor.
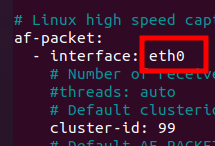
sudo nano suricata.yamlNext, let’s look for the line that describes af-packet. Inside the line “- interface: eth0” we will remove the “eth0” and include the name of our interface.
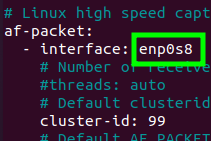
In our case the interface that will be monitored is “enp0s8”. So let’s replace the interface name in the “suricata.yaml” file.
After that, let’s save the file.
The next step is to restart the Suricata for the change to take effect. For that, we can use the command below.
sudo service suricata restartUpdate on Suricata Rules
Now let’s update the Suricata rules. Initially the Suricata contains some basic rules. However, we want a larger set of rules so that the Suricata can find a greater number of anomalies
We can verify the initial rules by checking the files that are inside the suricata rules directory. So we can use the command below to enter the directory and check the rules that exist in the files.
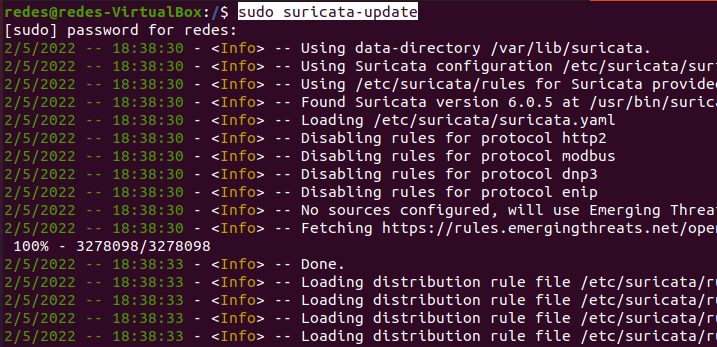
cd /etc/suricata/rules/Now, let’s update the rules and add new rules to the Suricata. For this we will use the command below.
sudo suricata-updateWe can see that new rules have been downloaded.
Testing Suricata
Now we can test the Suricata. For this, we will use the command below.
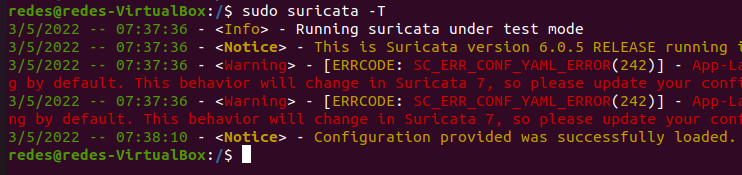
sudo suricata -T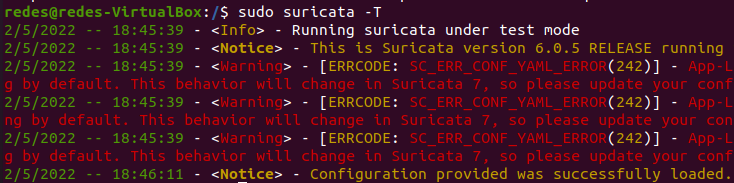
We can see that there were some “warnings” alerts for some protocols that were not enabled. In this case, if the protocol is not enabled in the “suricata.yaml” configuration file, we will have alert messages.
However, you can choose to disable certain protocols that will not be used on your network.
In the previous figure we had the alert message that informed that the rdp protocol was not enabled.
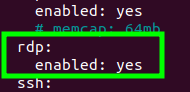
However, let’s assume that we want to use the RDP protocol on our network. In this way, we will return to the “suricata.yaml” file and we will enable RDP just by uncommenting the “#” line.
sudo nano /etc/suricata/suricata.yaml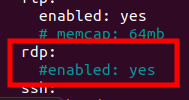
Now, let’s restart the Suricata for the change to take effect. For this we will use the command below.
sudo service suricata restartThen, let’s run the test again with the command below.
sudo suricata -TVery well, now we can see in the figure below that the warning message “warning” for RDP has disappeared.
The Suricata Logs
Using the installation of this tutorial, the log files and alerts will be stored in “/var/log/suricata/”. That way, we can go into that directory and list the contents to see what we have.
cd /var/log/suricata/

ls
We can observe that we have several log files. However, in this tutorial we are going to talk about the “suricata.log” and “fast.log” files. Thus, the “suricata.log” file presents the logs referring to the operation of the suricata tool. An example log of “Suricataa.log” can be obtained using the command below.
tail suricata.log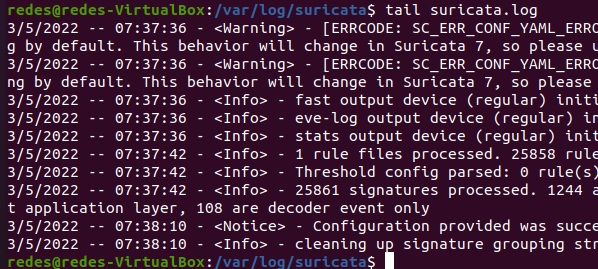
The other file, “fast.log”, presents the alerts generated by the Suricata. That way, you can check for alerts by inspecting the “fast.log” file. For that, we can use the command below.
tail fast.logAt first, the “fast.log” file may not contain any alerts. Therefore, in the next section we will present a test to generate alerts in the Suricata.
Testing Suricata as IDS
Let’s test the Suricata using a second virtual machine that will be connected to the internal VirtualBox network and consequently will be connected to the “enp0s8” interface of the Suricata machine.
As a second client we are using a virtual machine with Ubuntu turned on with an interface in internal network mode.
Below we have the topology used.
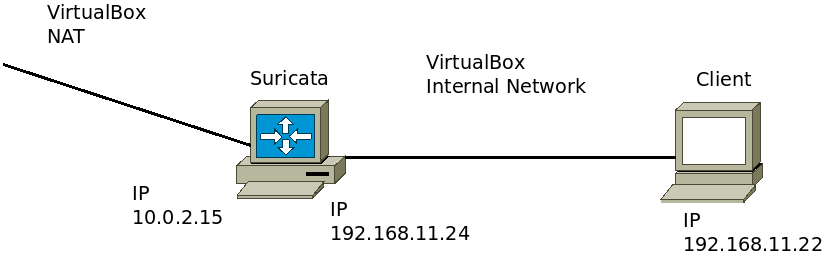
On the client machine we have NMAP installed and we are going to run a scan on the Suricata machine to see if it generates alarms.
This way, let’s use the command below on the client machine to start scanning ports on the machine where we have Suricata.
sudo nmap -sO 192.168.11.24If you want to understand how NMAP works, you can see the following posts:
NMAP: Identify the version of a service
NMAP: TCP and UDP port mapping
After using nmap, let’s go back to the Suricata machine and check the alerts file “/var/log/suricata/fast.log”. For this we can use the command below.
tail /var/log/suricata/fast.log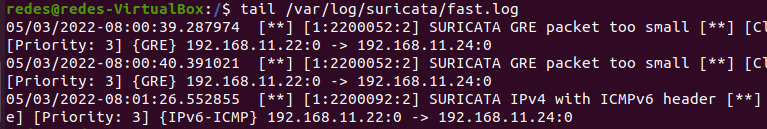
We can see that the Suricata is already inspecting our network interface and is consequently generating alarms. In addition, alarms display the date they occurred and a brief description of the alert.
In the alert description we can have an alert ID and the alert priority level. In the future we will present more information related to Suricata in future tutorials.
This tutorial is part of the Suricata Linux Course.
Lesson 1: Install Suricata on Linux
Lesson 3: Suricata Network IPS
If you liked it, comment on our YouTube channel in the video below.
See more:
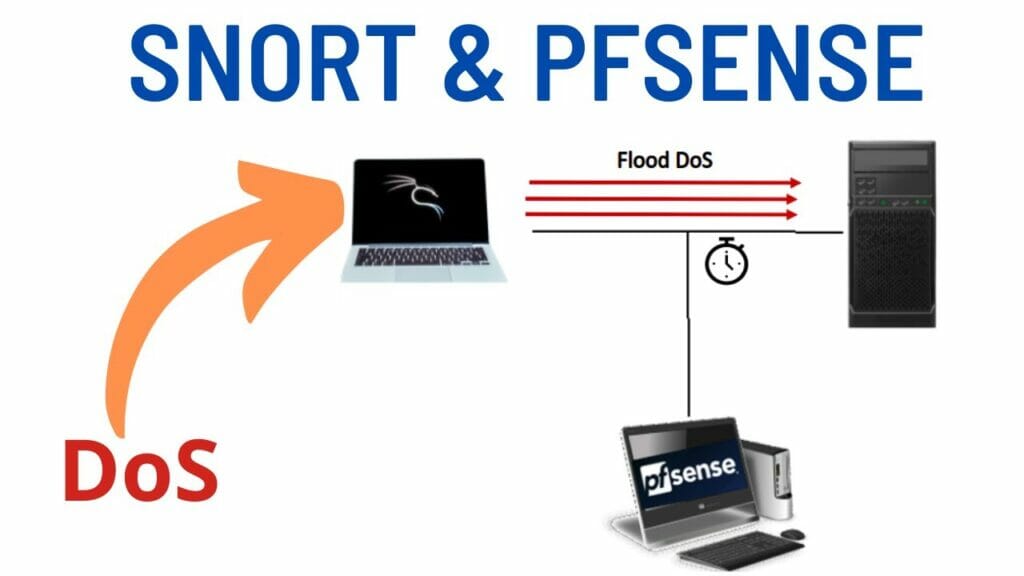
Snort PfSense : Detect DoS Attack
NMAP: Identify the version of a service
NMAP: TCP and UDP port mapping
Addrwatch : Install and Configure
Arpwatch: Installation and Configuration

Juliana Mascarenhas
Data Scientist and Master in Computer Modeling by LNCC.
Computer Engineer