If you manage a Zabbix environment, you’ve probably been there: a crowded “Problems” screen, where it’s hard to distinguish a critical production server from a forgotten test machine.
In the past, we relied exclusively on Hostgroups to try to organize this mess. But in modern versions of Zabbix, there is a much more powerful and often underused tool: Tags.
In this tutorial, I’ll teach you how to register and use Tags to transform your monitoring governance.
What are Tags in Zabbix and why use them?
Tags are pairs of Name and Value (e.g., Environment: Production or App: CRM) that you can assign to specific Hosts, Templates, or Triggers.
Unlike groups, tags allow for multidimensional classification. A single incident can carry the information that it belongs to Datacenter X, Client Y, and is the responsibility of Team Z, all simultaneously.
The main benefits are:
- Fast Filtering: Find specific problems in seconds.
- Event Correlation: Reduce alert fatigue by grouping related failures.
- Automation: Direct emails or Telegram messages based on the tag (e.g., Tag
Team:DBAsends alert only to DBAs).
Step-by-Step: Registering your First Tag
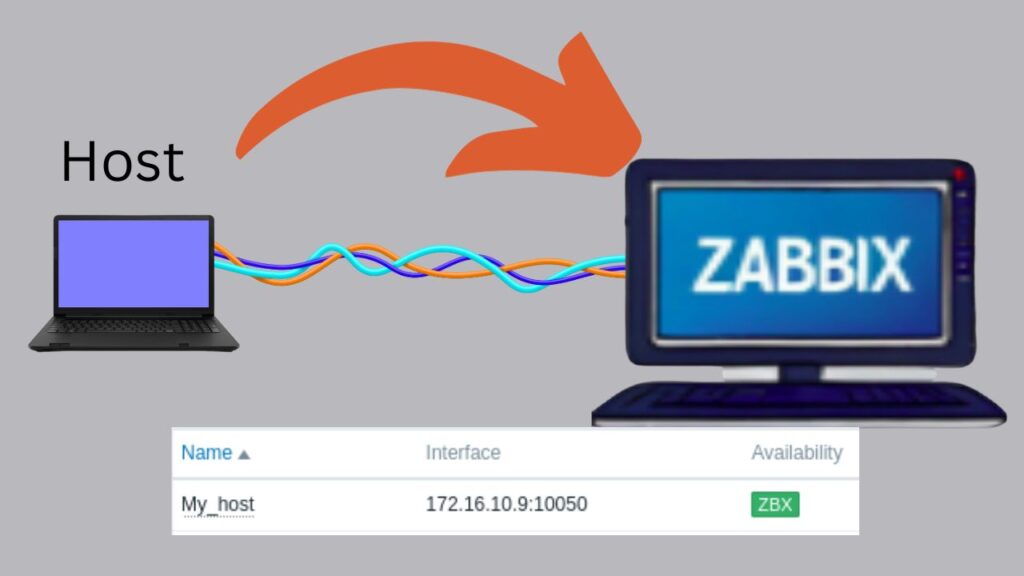
Let’s get practical. I’ll show you how to add a Tag at the Host level, which is the simplest way to start organizing your house.
1. Access the Host configuration
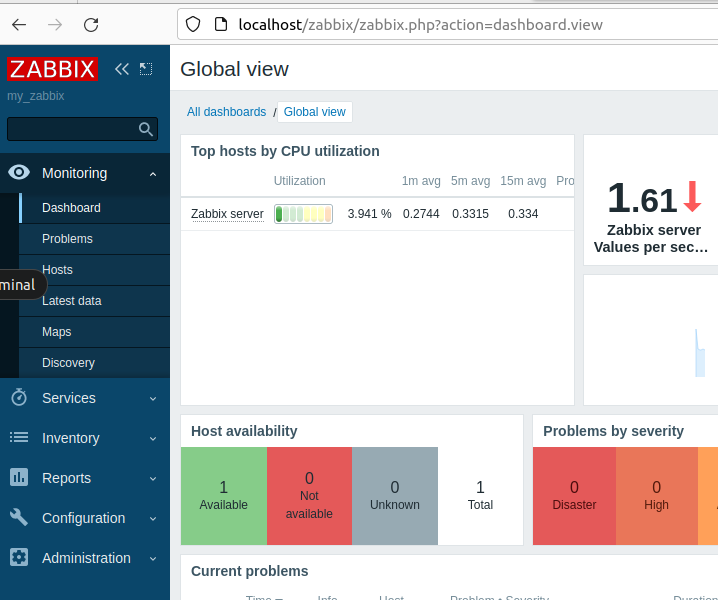
In the Zabbix side menu, go to Monitoring > Hosts. Choose the server you want to tag and click on its name.

- Click on Monitoring.
- Click on Hosts.
- Double-click on the IP or Hostname.
Now let’s select Host in the new menu.

2. Add the Tag
Inside the host settings, click on the Tags tab. Here you will see two fields: Name and Value.
Let’s create a tag to identify the environment.

Now, let’s include the Tag name and the Tag value.

In this case, we used the name Environment to express our company environment and entered the tag value as Production to mark the machine as a production server.
Now, let’s insert a new Tag with the goal of describing that the host is in the AWS datacenter in the city of São Paulo. To do this, we will use the tag name Datacenter and the value AWS-SP.

Click the Update button to save.

You can add as many as you want. Another common suggestion is to identify the location:
3. Viewing the Result
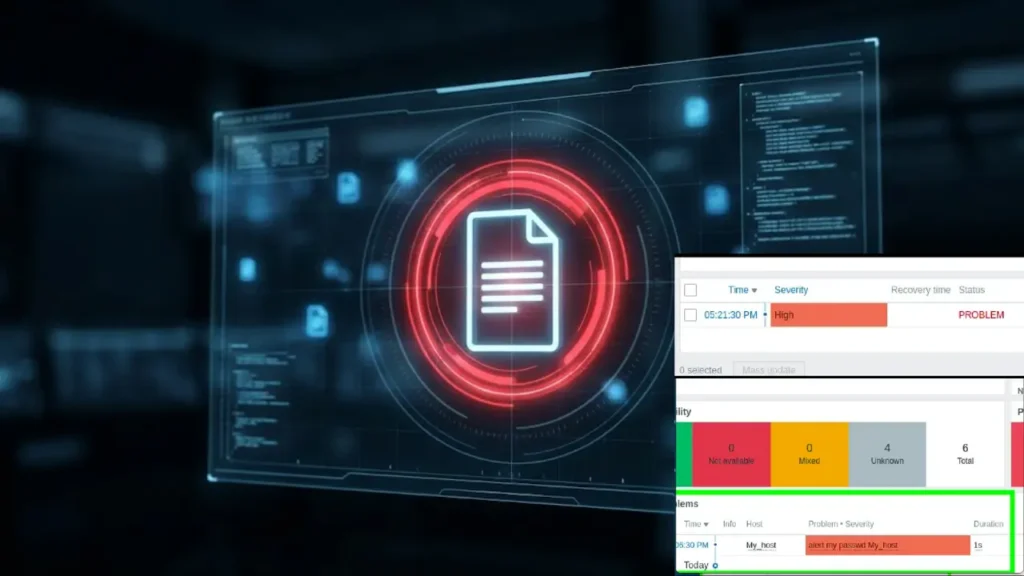
The magic happens now. Go to the menu Monitoring > Problems.

If this host has any active incident (or if you simulate one), you will see the new colored labels appearing in the Tags column. Now, you can use the filter at the top of the page to display only problems where the Tag is Environment: Production.
Pro Level: Scaling with Templates (The Enterprise Strategy)
Configuring host by host works fine for 10 servers. But what if you have 500?
The real power of Zabbix is in inheritance. Instead of tagging each server manually, you should tag the Template.
For example: If you add the tag OS: Linux to the Linux by Zabbix agent template, all servers using this template will inherit this tag automatically.
How to do it:
- Go to Data collection > Templates.
- Search for the desired template and click on it.
- Go to the Tags tab and add your global labels.
This ensures standardization. If a new server comes in tomorrow, it is born tagged, without relying on the analyst’s memory.
🔍 Reaping the Rewards: Filtering the Noise
Now that your environment is classified, you stop looking at “all problems” and start looking at what matters.
In the Monitoring > Problems menu, click on the filter bar at the top. In the Tags field, select the “And/Or” option and type:
- Tag:
Environment - Value:
Production
When you click Apply, Zabbix will instantly hide all alerts from Test or Development environments. This is essential to keep the NOC (Network Operations Center) focused on critical incidents, ignoring lab noise.

Conclusion
Implementing a Tag strategy is the turning point between a “Zabbix that just alerts” and a “Zabbix that generates intelligence”. Start tagging your critical hosts today and see the clarity of your dashboard increase immediately.
See more:
Monitor Your Router with Zabbix: The Definitive ICMP Ping Guide
Zabbix Appliance on VirtualBox
https://www.zabbix.com/community

Juliana Mascarenhas
Data Scientist and Master in Computer Modeling by LNCC.
Computer Engineer

How to Configure NAT in Packet Tracer (Step-by-Step)
Zabbix FIM: How to Setup File Integrity Monitoring
Configure DHCP in Packet Tracer: Server & Router Guide

Cheap SSDs: The Hidden Dangers of TLC, QLC & DRAM-less

Zabbix Tags Guide: Organizing and Filtering Monitoring Alerts
If you manage a Zabbix environment, you’ve probably been there: a crowded “Problems” screen, where…

Flooding Routing Algorithm: How It Works & Use Cases
Let’s talk about one of the most primitive and, at the same time, most robust…