Your internet is down… again. Was it the provider? Did the router crash? Or did someone trip over the cable? For those who work from home, play online, or simply can’t live without a connection, this uncertainty is frustrating.
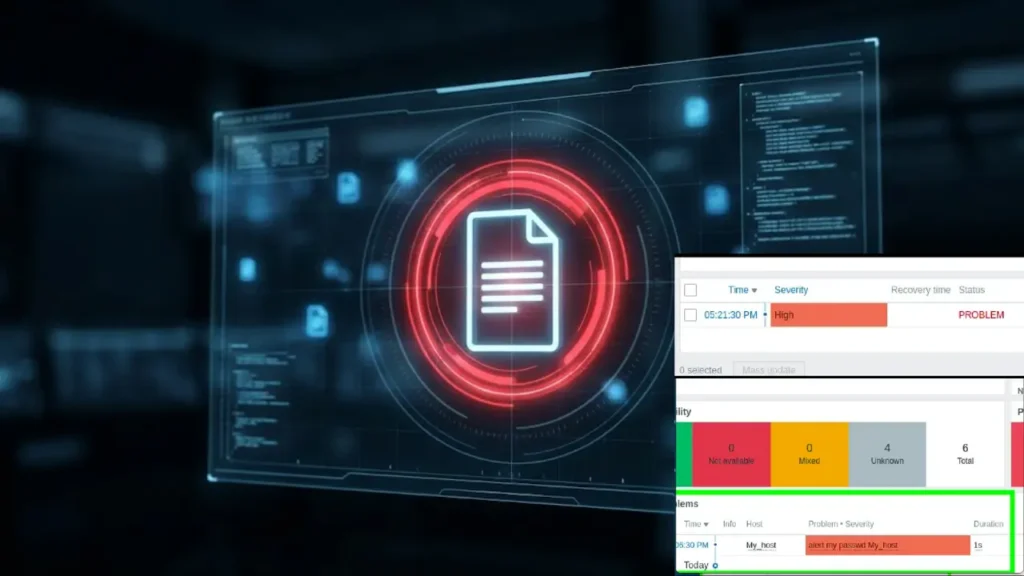
What if you could have a “digital watchman” that would notify you the exact moment your router or gateway goes offline? And what if, on top of that, it kept a history of all the outages?
Good news: this tool exists, it’s free, professional, and it’s called Zabbix. In this complete guide, we’ll teach you, step by step, how to perform simple and powerful monitoring using just “ping” (ICMP). Stop guessing, it’s time to monitor!
Why Monitor Your Own Router?
You might be wondering: “Is it worth the effort?”. Absolutely! The benefits are immediate:
- Proactivity: Get an alert as soon as the connection drops, even before someone in your home or office complains.
- Quick Diagnosis: Know if the problem is internal (crashed router) or external (internet provider failure).
- Outage History: Keep a record of all outages, with date and time. Great for holding your provider accountable for instability!
- Learning: It’s an excellent project to enter the world of network monitoring, a highly valued skill in the IT market.
Prerequisites for Monitoring Your Router with Zabbix
For this tutorial, we will need just two things:
1. Zabbix Installed: You need a running instance of Zabbix. If you don’t have one yet, the process is simple we have a step-by-step guide here.
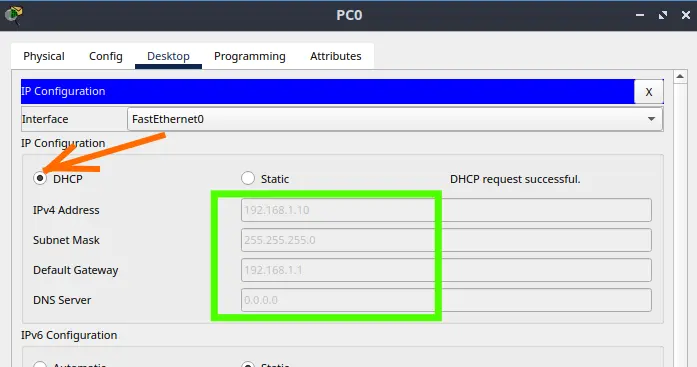
2. Your Router/Gateway IP: This is the “address” of your device on the network.
Quick Tip: To find your gateway’s IP in Windows, open the command prompt and type:
ipconfigOn Linux or macOS, open the terminal and type:
ip r | grep defaultThe address is usually something like 192.168.0.1 or 192.168.1.1.
Adding Your Router to Zabbix Monitoring
Our goal is to configure Zabbix to “ping” the router every minute and alert us if it doesn’t respond.
We will use a ready-made Zabbix template called ICMP Ping, which makes everything incredibly easy.
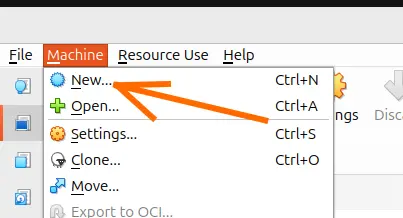
Step 1: Navigating to Host Creation
In the main Zabbix menu (on the left), follow the path:
Data Collection > Hosts

Click the blue Create host button in the upper right corner of the screen.

Step 2: Configuring Basic Information (The “Host” Tab)
Here, we’ll tell Zabbix what it’s going to monitor.
Host name: Give it an easy-to-identify name. Ex: my_router.
Next, type icmp in the Templates field. When you type icmp, the ICMP ping template will appear, and we will click on it.

Host groups: Organize your devices. In this case, we will add our router to the Discovered hosts group.
To do this, we can type discover in the Host groups field and we will select the Discovered hosts group that appears.

Interfaces: Here’s the secret!
Click on Add and select Agent.

In the IP address field, enter the IP of your router that you found earlier. Then, click Add.

Attention: Don’t worry, you don’t need to install anything on the router. Zabbix uses this interface only as a target for the ping.

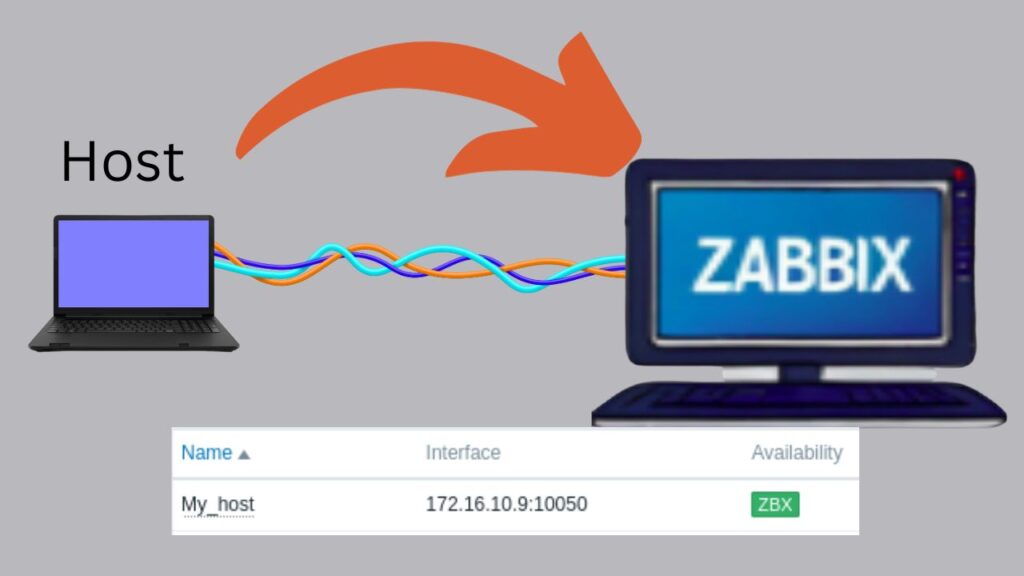
We can see that our router has been added successfully.
Checking the monitoring of your router in Zabbix
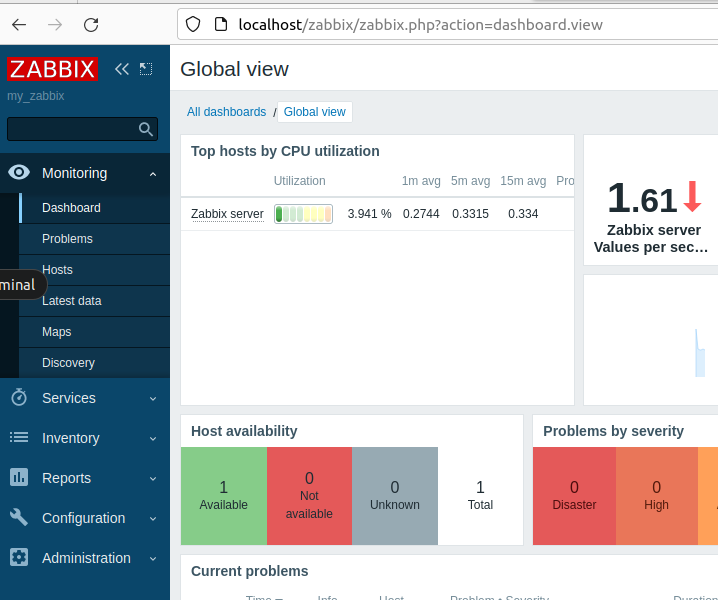
Now, let’s check what we can already monitor on our router. To do this, let’s click on Monitoring in the left corner and then click on Hosts.

Next, we will find the name of our router and then click on Latest data, as indicated by the arrow in the figure below.

Now, we can see the data being stored about the pings to the router. Let’s look for the ICMP response time option and click on Graph.

And we can already see the graph showing the variation in ping response time to the router.
You can modify the graph to see the result for the last 5 minutes or another period you wish.

Conclusion
With a few clicks and without a single line of code, you have transformed your Zabbix into a powerful alert system for your internet connection.
Now, you have the power of information, moving from reaction to proactivity.
So, were you able to set it up? What else would you like to learn to monitor with Zabbix? Leave your comment below!
See more:
How to install Zabbix on Raspberry Pi
Zabbix Appliance on VirtualBox
https://www.zabbix.com/manuals

Juliana Mascarenhas
Data Scientist and Master in Computer Modeling by LNCC.
Computer Engineer

Email Server & Webmail Setup: Postfix, Dovecot, SnappyMail
Install Ubuntu Server 26 on VirtualBox (Step-by-Step)

How to Configure NAT in Packet Tracer (Step-by-Step)
Zabbix FIM: How to Setup File Integrity Monitoring
Configure DHCP in Packet Tracer: Server & Router Guide