We will teach you how to add a host to Zabbix and start monitoring the host.
For this tutorial, we will use the Zabbix agent on a host with a Linux operating system. However, the procedure is similar for adding hosts with different operating systems such as Windows and macOS.
Configuring the Zabbix server
Let’s access the Zabbix server through the browser.
The scenario we use for this lab is shown in the figure below. We have the Host machine and the Zabbix server machine connected. This connection can be physical or using virtual networks, as in the case of VirtualBox or VMware.
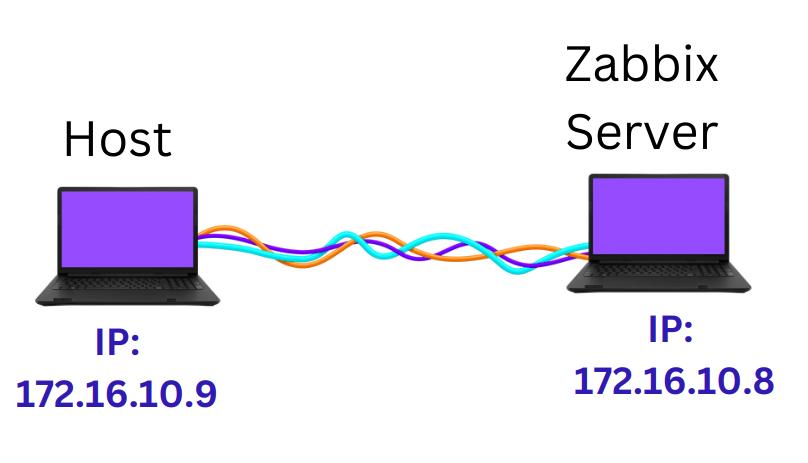
In our case, we are on the same machine where the Zabbix server is running. Therefore, we can use the loopback IP “http://127.0.0.1/zabbix”.
http://127.0.0.1/zabbix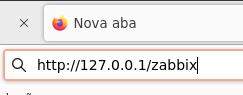
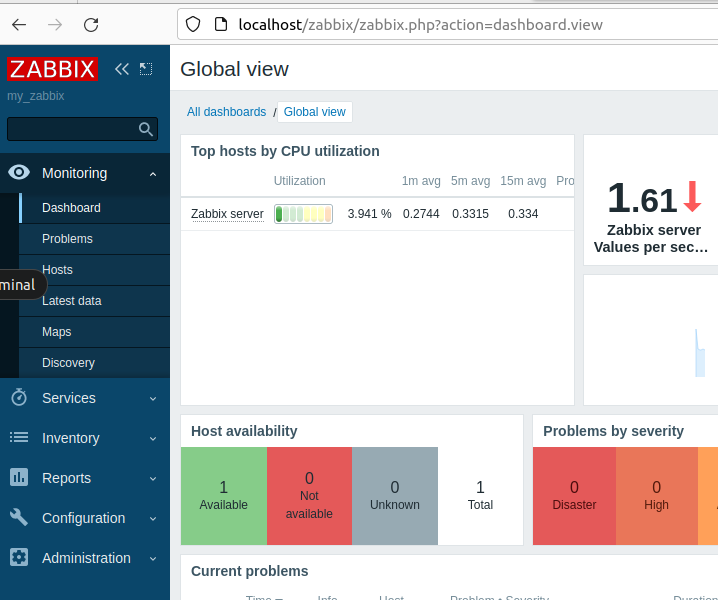
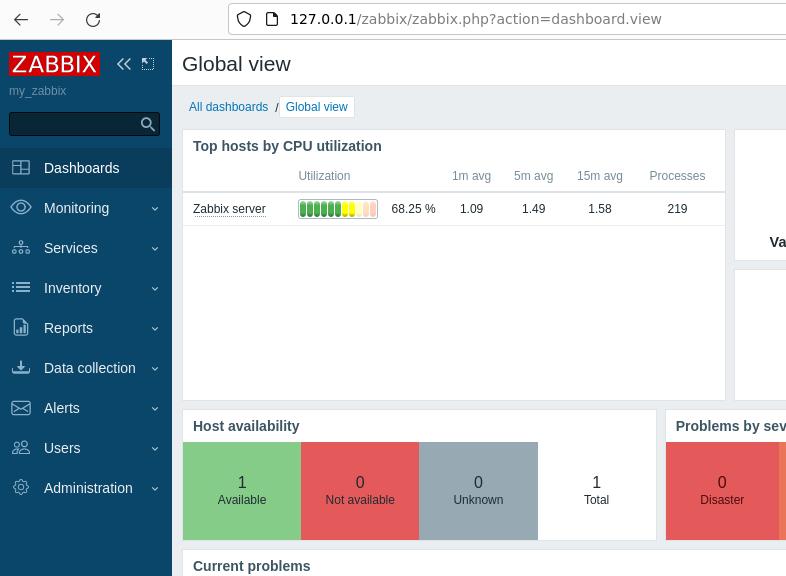
Next, we will see the main screen of the Zabbix server as in the figure below.
Creating the new host on the Zabbix Server
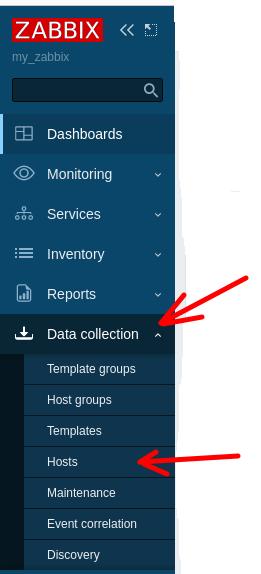
Now let’s start the process of adding a host to Zabbix. To do this, we will click on “Data Collection” and then on “Hosts” in the left menu.
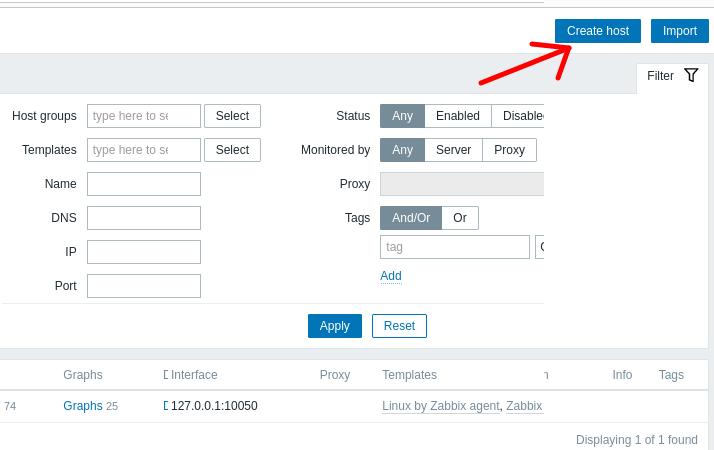
Next, at the top of the screen, we will click on “Create host“.
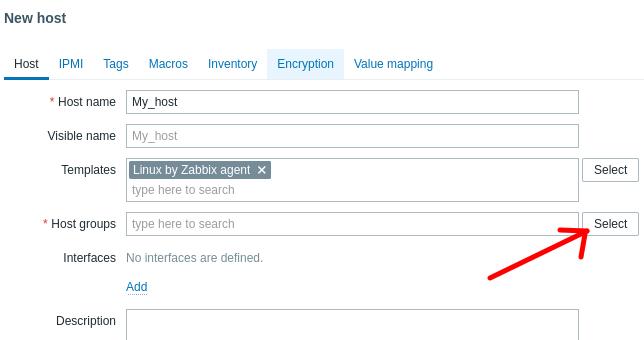
Now we will see the host insertion screen. On this screen, we will give a name to the host we are going to monitor. In our case, we are naming it “My_host”.
Adding a Template to the host
Next, we will add the monitoring template. To do this, we will click on “Select” in the Templates row.

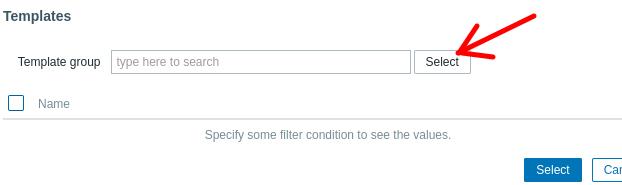
After clicking “Select” in the Templates row, we will see the screen below.
And we will click on “Select” as in the figure below.
Now, let’s choose the type of template we are going to use. In our case, we are going to monitor a standard machine, so we will choose to monitor based on the operating system. To do this, we will click on “Templates/Operating systems“.

Now let’s choose the operating system we are going to use and the data collection mode for Zabbix. In our case, our host is a Linux machine and we will use the Zabbix agent. Therefore, we will click on “Linux by Zabbix agent” and then we will click on “Select“.
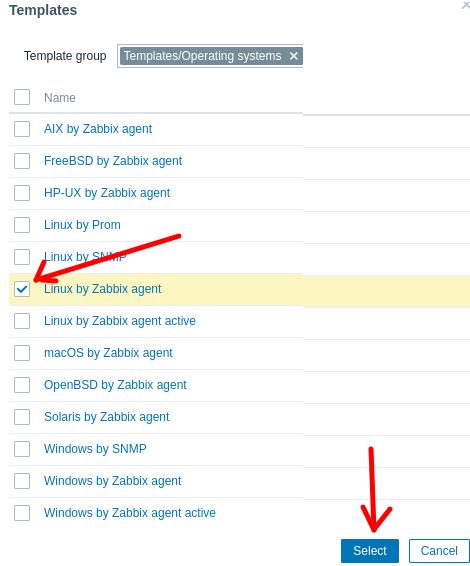
Note: If you are using another operating system such as Windows or macOS, choose the appropriate field.
Adding the host to a Host Group
Now let’s add the host group that the new host will belong to. To do this, we will click on Select in the “Host groups” row.
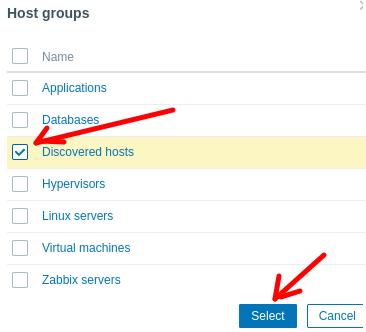
Next, we will choose a group for our host. In this case, we will choose the “Discovered hosts” group and then we will click on “Select“.
Adding an Interface to the host
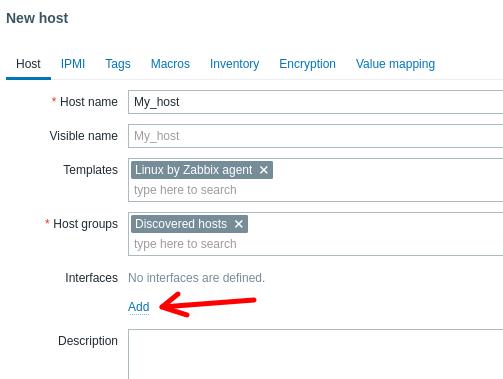
The next step is to add the interface. To do this, we will click on “Add” in the “Interfaces” field.
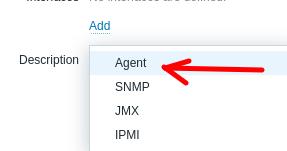
Since we are going to use the Zabbix agent on the host, we will choose the “Agent” option.
Now let’s enter the IP of the host we want to monitor. In our case, the host IP is “172.16.10.9”. After entering the host IP, we will click on “Add”.

Checking the added host
The figure below shows that the host was added to Zabbix. However, we can verify that the “Availability” field is not yet showing the host status in green.
To show the “Availability” field in green, we will install and configure the Zabbix agent on the host we want to monitor.

On the host machine
Let’s open the terminal to install the Zabbix agent. In our case, we are using Ubuntu, and therefore, we will first update the repositories with the command below.
sudo apt updateInstalling the Zabbix agent on the host
First, let’s access the Zabbix link below and then perform the steps below.
https://www.zabbix.com/download
Then click on Zabbix Packages.

Now, let’s choose the correct version for the operating system type.

- We choose the latest version of Zabbix. (If there is a newer version, download the newest one).
- Now let’s choose the operating system. Ours is Ubuntu.
- Next, we will choose the version of our operating system.
- Finally, we choose Agent.
Next, we will start the installation of the Zabbix agent with the command below.
First, let’s enter the terminal and become superuser with the command below.
sudo -s
Now, on the Zabbix page you are on, you will select the line that starts with wget. Select the entire line and copy it (Ctrl + c).

Then, paste the line into your terminal and press enter.
wget https://repo.zabbix.com/zabbix/7.4/release/ubuntu/pool/main/z/zabbix-release/zabbix-release_latest_7.4+ubuntu24.04_all.deb
Now, let’s unpack it using the command below.
dpkg -i zabbix*
Next, we will update the repositories.
apt update
Now, let’s install the Zabbix agent with the command below.
apt install zabbix-agent -y
Configuring the Zabbix agent on the host
Now, let’s edit the Zabbix agent configuration file. To do this, we will type the command below in the terminal.
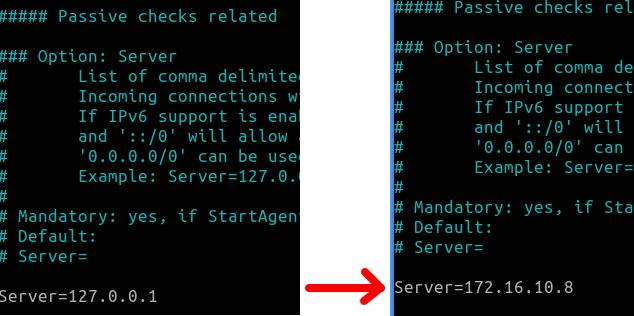
sudo nano /etc/zabbix/zabbix_agentd.confOnce inside the “zabbix_agentd.conf” file, we will look for the part related to the passive monitoring configuration. In this case, the Zabbix server initiates the connection for monitoring.
Next, we will change the “Server=127.0.0.1” field to the IP of our Zabbix server. In our case, the IP of our server is “172.16.10.8”.
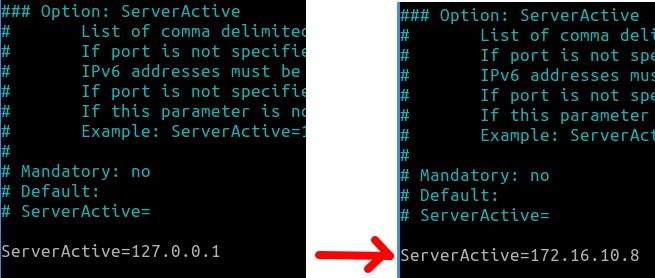
Now, let’s look for the active mode monitoring configuration. In this case, the Zabbix agent will initiate a connection with the Zabbix server.
Here we will also change the IP in the configuration file from “127.0.0.1” to the IP of our Zabbix server, “172.16.10.8”.
Since we are using active mode monitoring, we will have to change the field that specifies the name of our host. This step is very important, as we must enter the exact same hostname we used when creating the host on the Zabbix server.
In our case, the name we gave to our host on the Zabbix server was “My_host”.

After making the changes, we will save them and exit the file.
Restarting the Zabbix agent
After changing the “zabbix_agentd.conf” file, we need to restart the Zabbix agent. To do this, we will use the command below.
systemctl restart zabbix-agent
or

Next, we will enable the Zabbix agent on startup with the command below.
systemctl enable zabbix-agent
Returning to the Zabbix server
Now let’s go back to the Zabbix server to verify if the newly added host already appears in the monitoring.
We can look at the screen where we added the host to the Zabbix server and press the “F5” key to refresh the page on the Zabbix server.
If everything went correctly, we will see a screen showing the “Availability” field in green.

Monitoring the host
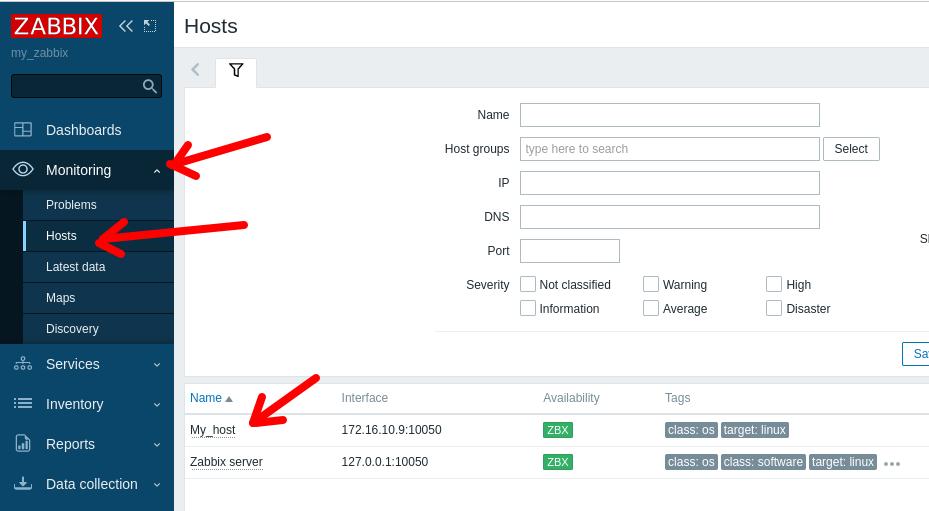
Now, we can monitor the host we recently added. To do this, we will access the left menu and click on “Monitoring” and then on “Hosts”.
We can see that, as shown in the figure below, our newly added host appears to be monitored.
More about Zabbix:
Monitor Your Router with Zabbix: The Definitive ICMP Ping Guide
How to install Zabbix on Raspberry Pi

Juliana Mascarenhas
Data Scientist and Master in Computer Modeling by LNCC.
Computer Engineer
Reference Links:
https://www.zabbix.com/manuals