Data Science has been growing in the Technology market. Okay, but do you already know the paths you could take start the data science career? That is the purpose of this article.
First, we will solve your doubts about existing professionals and their attributions. Let us go.
- Why is this professional being so sought after?
- Profiles of Data Career Professionals?
- Data Engineer
- Average salary of a data engineer
- Data Analyst
- Business-focused Analysis Tools
- Average salary of a data analyst
- Data Scientist
- Technologies used by data scientists
- Skills requested by companies
- Average salary of a data scientist in Brazil
- Data Science Career Video
Why is this professional being so sought after?
Over time, computing has evolved rapidly, almost exponentially. This advance results in creating more robust hardware and, consequently, more powerful software. The improvement of the hardware fueled the evolution of the software.
When do we generate data? We produce an infinity of data through simple internet browsing and consuming web pages. Every service available on the network generates data associated with its customers. This data needs to be stored for further analysis.
Okay, why do they say data is new gold? The data directly influence the company’s decision-making.
We can better understand this impact’s size with examples, such as process optimization, profit increase, higher engagement rate, value prediction, classification, and characterization of behaviors.
Profiles of Data Career Professionals?
Within this context, who are the professionals working on polishing this raw diamond (data) and transforming it into useful information for decision-making?
As a data scientist, I realize that there is still an inevitable “confusion” about the limitations of each professional. For example, when searching for jobs on LinkedIn, it is common to find assignments from analyst (or engineer) to scientist. Even so, we found a defined role as an analyst with the role of a scientist.
This overlapping functions with a mixture of nomenclatures because it is a new area disseminated in Brazil and other countries. As the data career is still in its infancy, it is common to see this variation.
Within the data career, we can define three primary roles. Of course, there are others on the market, but if you look closely, you’ll notice that it fits into one of these three profiles that we will discuss now.
Who are data science professionals?
- Data Scientist
- Data Analyst
- Data Engineer
Data Engineer
All right, what makes a data engineer? This professional is focused on designing, building, and maintaining data solutions. In other words, this professional is responsible for handling the data and designing a storage structure for this data according to the context or demand.
Therefore, the data engineer will determine the best system to provide the persistence of this data. After this step, they can finally be analyzed by another professional. One more thing at a time. How does this happen?
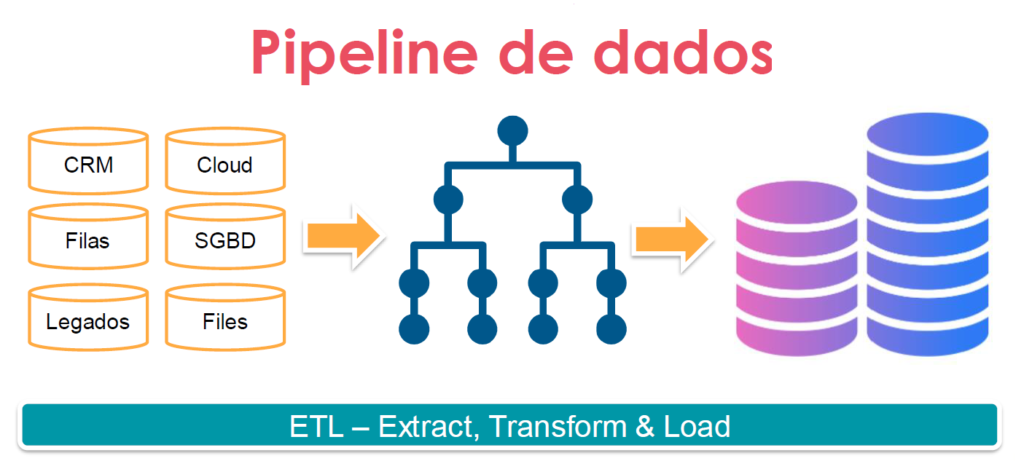
ETL Process
A process directly related to the data engineer is known as ETL – Extract Transform & Load. Briefly, this process comprises collecting, cleaning, structuring, and maintaining data in a system.
Extract (Extract)
Starting with the extract or extraction, we can already have an idea about this ETL step. Here the engineer will work with data collection solutions. These solutions can include Relational or NoSQL DBMSs.
In addition, we have programming languages available to work with APIs. Additionally, web scraping can be used for data collection. However, one issue is worth mentioning before continuing: Be careful to overcome legal issues and perform web scraping without permission.
Collecting information from pages using this technique without permission may be considered unethical. Therefore, be sure of what you are doing.
Transform (Transform)
After the data collection stage, we are faced with a difficult task. The data transformation phase is related to data cleaning and structuring.
That is right, cleaning. This term is designed to describe the data refinement step.
Data does not arrive ready to use. In addition, the data are primarily collected from heterogeneous sources to compose the same context. Therefore, each dataset will have a distinct structure.
It is up to the engineer to remove redundancies and unnecessary information and fill in gaps when possible. That way, he can define which structural model to use for the loading process.
In this step, if necessary, you will use some programming language to transform and automate this process. Importantly, data must have cohesion in order to be meaningful. The value of the analysis is linked to the quality of the data.
Load
Now the data must be transferred to the corresponding system of your structure. We can mention data lakes, relational DBMSs, NoSQL, and other data storage/management systems in this case. We can also use these solutions in a cloud environment as a service.
This step consists of adapting/configuring systems in addition to a possible integration between systems. Consequently, the engineer will maintain a structure for the data, gagged and persisted, for further analysis.
The engineer, at various times, will need to maintain the “round” structure for consumption by analysts and scientists. Who knows, even dealing with integration issues between systems like MySQL and Power BI.
Big Data Paradigm
With the evolution of technology, real-time applications, and large volumes of data generated on the Internet, a new paradigm has emerged: Big Data. Imagine this whole process now assigned to the significant data context.
The Big Data paradigm is based on 3 Vs: Speed, Variety and Volume. These are the main characteristics corresponding to Big Data.
The data engineer must be able to handle data generated at a high baud rate. This data is usually linked to high system demand. This type of scenario differs from “traditional” data, that is, data that follow the relational model.
NoSQL database management systems are often associated with this scenario. For example, among the NoSQL (read – Not Only SQL), I can also mention the structures: wide-column, graphs, document-oriented, and key-value, among others.
NoSQL DBMS can be used in conjunction with relational ones to meet the access demands of companies. A real-world example is the well-known Black Friday.
For relational DBMSs to supply overwhelming demand, investment in the vertical growth of the infrastructure is necessary. However, this leads to high costs in meeting a punctual demand. Therefore, we can use a NoSQL DBMS instead of spending to make the server more robust.
NoSQL inherits several characteristics of distributed systems, such as: scalability, performance, independent failures, heterogeneity, and transparency. These aspects are fascinating in scenarios like Black Friday: punctual and high demand.
Data Flow
Another assignment of a data engineer that ends up being requested by companies is knowledge of advanced software architectures, such as: messaging and event-oriented systems. These systems have asynchronous communication.
Asynchronous communication becomes interesting in many scenarios compared to a traditional system. Let us think for a moment. Imagine that you start to notice an increase in demand for your services.
In a synchronous system, the endpoints must be online for the operation to be successful. However, the server can be overloaded, like DoS, unable to process the information anymore.
With their asynchronous communications, messages and/or event systems allow for a better user experience. In this case, it will not be necessary to invest vertically in network infrastructure.
A server that will retrieve messages can do so at a later time. In other words, the consumer node can choose when to process information. Therefore, it provides greater availability, performance, and user experience.
About these systems, we can mention the main ones: RabbitMQ and Kafka
Summing up
The engineer is responsible for the solutions/systems with data management and persistence, providing a ready structure for further analysis.
Study Topics for a Data Engineer Career
- Relational and NoSQL DBMS
- Python, Java
- Container Orchestration and Clustering
- Event-Driven Systems
- Messaging Systems
- ETL Process
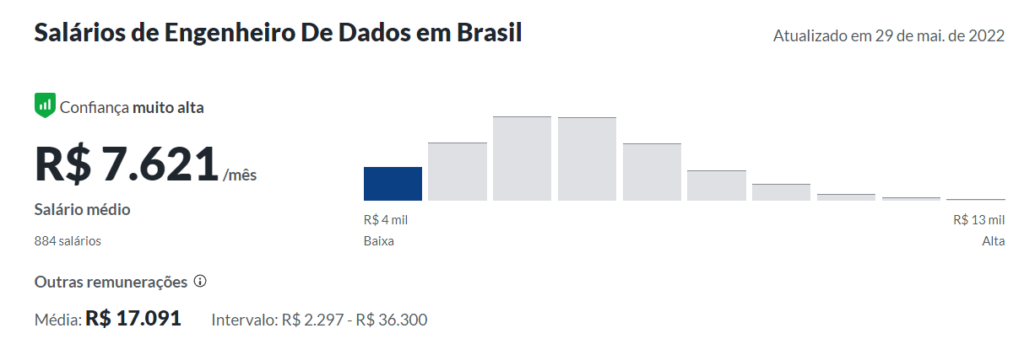
Average salary of a data engineer
The average salary of a data engineer according to www.glassdor.com is approximately $7,000. However, there are variations according to the level of each professional. Senior engineers can be paid in the range of R$10,000.
Data Analyst
The data analyst’s focus is on analyzing business-oriented data. Its main objective is to show policies and results of company metrics visually.
Therefore, this professional needs to know the context in which the company is inserted. That way, he can formulate the most appropriate questions for your scenario.
Generally, it answers questions related to directives and business rules. The data analyst must be able to “tell” the story of the data through dashboards, graphs, reports and other visual devices.
Practical examples are associated with reporting from sales, marketing, finance, government, industry and other market-oriented branches.
An analyst needs to understand the data’s context, analyze it to infer information and insights, and present it to stakeholders. Once you have found the answers to your questions, specific patterns within the data need to be visualized.
In most cases, the analyst will retrieve data from DBMSs. Most business scenarios use traditional relational database systems. Therefore, the analyst must know SQL.
From this data, the analyst will use the BI – Business Intelligence – approach to analyze the data. Then, with the analysis in hand, the analyst can answer questions and create reports and dashboards.
Critical points for a data analyst
- Analytical thinking to turn data into information
- Understand sales and business
- Know the difference between value and price
- Turn data into outlets decisions that influence the health of the company
- Teamwork (data team: engineer, analyst and scientist)
Business-focused Analysis Tools
The analyst’s focus is on business analysis. Therefore, the tools used by this professional include:
- SAP and SPSS
- Excel, or Google Sheets
- Tableu or Power BI, Qlik
- Relational DBMS – SQL
Average salary of a data analyst
Average salary based on glassdoor.

Data Scientist
What is a data scientist really?
Data science is an interdisciplinary field where the professional will convert data into useful information and insights. The areas covered by data science are computing, mathematics, and modeling.
A data scientist uses computational techniques with models and metrics based on statistical mathematics to obtain insights and generate inferences about a context.
Exploratory and analytical thinking accompany the data scientist in his daily life. Therefore, the scientist searches the data for information that explains the context in which these data are inserted.
Characterization, classification, prediction, and interpretation of the context are part of its repertoire.
Although the scientist’s job is well defined, this professional often performs tasks assigned to other data professions. Therefore, the scientist must know the ETL process. That way, he will have a macro view of the situation.
Often, a scientist will need to perform data collection, cleaning, and transformation for further analysis. This entire process can be performed using the Python programming language (or another one of your choice). In addition, scientists may have to represent their insights graphically.
Okay… what’s the difference between an analyst and a scientist?
The analyst is concerned about business bias. Therefore, he needs to have the business Known How. Another characteristic of this professional is his time perspective. The analyst is aware of the past and understands how a company’s indicators evolved over time.
The scientist is concerned with understanding the snapshot provided by the data. Therefore, it focuses on the events’ characterization, classification, and prediction (prediction). His gaze is more toward the future compared to the analyst.
Understanding a little more …
The Bid Data paradigm is also present here. Often the scientist will analyze data that deviate from the traditional pattern of the relational model. Therefore, you need to be equipped with techniques for analyzing large volumes of data.
In addition to these skills, companies have been requesting knowledge in natural language processing – NLP. With the popularization of AI agents, data has taken on another connotation. Therefore, it needs to be handled by the scientist.
We talk about techniques to analyze data with a scientist’s eye. So what are these techniques? We can separate the techniques into three major areas within Data Science: Machine learning, Network Data Science, and Statistics. We will talk about them shortly.
Statistical Approach
Statistics and linear algebra are part of the life of any data analysis professional. However, the data can be analyzed with a purely statistical bias. Additionally, it happens a lot in the academic realm. Statisticians and mathematicians use mathematical resources to model and explain phenomena through mathematical equations.
Also, we can see this scenario within the theoretical computation. For example, computing topics like cryptography are purely math-based. However, in the market, you will find that the math is applied to machine learning models and analytics metrics with complex networks.
Network Data Science
Network Data Science, or complex networks, uses graph theory to model, characterize and analyze data. In this case, the data is modeled for the structure of nodes (actors) and connections (relationships).
After modeling, we can apply metrics specific to this area, such as: degree centrality, pagerank, and betweenness, among others. For example, Google uses the Pagerank algorithm to index pages in the search engine.
Unlike the traditional relational model framework, we can define relationships for the data. This graph structure represents very well several real-world scenarios. For example, we can find the structure of complex networks in scenarios like:
- Social networks (users and friendships)
- Authors and publications networks
- Banking networks
- DNA mapping (connection between chromosomes)
- Public transport networks
- Airlines (cities and flight routes)
We can align this approach, complex networks, with several mathematical techniques, such as correlation, eigenvalue and eigenvector, and probabilities. Therefore, we can use Python libraries to create a robust analysis.
Some of these libraries are: Numpy, Pandas, and NetworkX (Complex networks).
Machine Learning
Machine learning techniques, or AI, can contribute to your data analysis. However, often the data analysis work performed by the data scientist comes before the application of ML models. After all, we can have a fantastic model, but we will not have good results with insufficient data.
Unlike data science, machine learning is a field of computing that works with informal systems that can learn. These systems are trained so that they can opine on unknown data. Therefore, the context is provided by the training data.
In this context, there are a few approaches: AI, artificial intelligence, which is a branch in its own right, but provides a foundation for ML; Deep learning – deep learning – with specific models in this area.
The goal of Machine Learning is in the recognition and detection of patterns in the processed data. We need to pay considerable attention to the training data for the quality of the results.
In short… in any analysis the quality of the data influences the result.
Data Visualization
A data scientist must be able to express their results clearly, objectively, and reasonably. Therefore, the data scientist must possess the Soft skill of storytelling.
To display the results visually we can use libraries for plotting graphs, such as Matplotlib (official site) of Python.
Following this topic, we can use dashboard creation tools like Power BI, Tableu, and Qlike. Using these tools, we can bring data to life through interactive dashboards.
There are several features associated with these tools. Power BI, for example, can be integrated with power point to create the presentation of the results.
Technologies used by data scientists
Python is used massively by data scientists. Therefore, the entire process can be built with it. In other words, the process of collecting, cleaning, modeling, analyzing, and visual representation.
However, we can mention other important tools.
- Data Analysis with Python
- Relational Database – SQL
- NoSQL Database
- Apache Spark
- Jupyter Notebook or Google Colab
Skills requested by companies
In this topic, we want to talk to you about issues that go beyond the basic skills of a data scientist. However, as knowledge is never too much, it is worth paying attention to the following topics:
- Git (versioning)
- Docker & Kubernetes
- MLOps – deploying and maintaining ML models
- AI – Artificial Intelligence
- BI Tools
Of the BI tools we can mention: Power BI, Google Data Studio, Tableu, Qlike, Locker, among others.
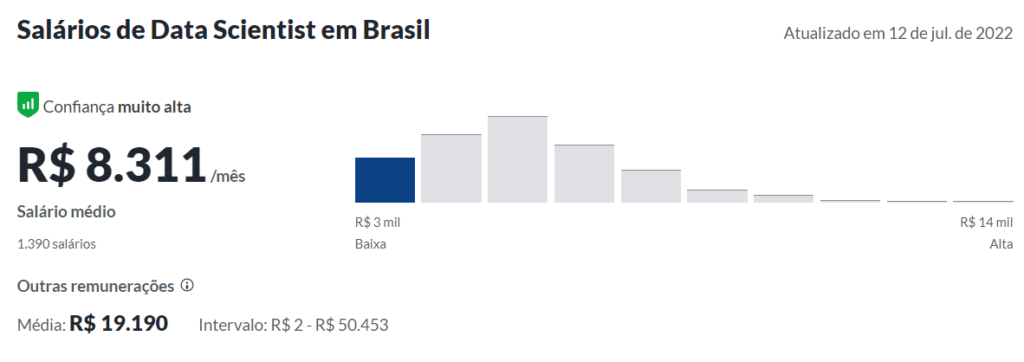
Average salary of a data scientist in Brazil
Average salary based on the website glassdoor.
Data Science Career Video

Juliana Mascarenhas
Data Scientist and Master in Computer Modeling by LNCC.
Computer Engineer