Making bad graphics is easier than you think. Nobody wants that, but it happens. Historically, we have not been trained, nor have we paid attention, to tell stories with numbers.
In this article we will understand the overview of storytelling. Also, how can this skill make us more accurate in our communication?
At the end I will bring examples that can be very useful to help understand this soft skill that is so necessary for analysts, data scientists and other professionals who need communication!
Why is it hard to create story with numbers?
What we learned over time were two subjects that didn’t talk to each other. In language, the famous Portuguese, we learn to create narratives. Weave plots, create apexes (climaxes) and add that hint of suspense to the stories.
Want an example? You probably know the story of Little Red Riding Hood, or a version of it. In it we have the 3 basic elements of a story: beginning, middle and end.

The stories aren’t linear and that’s what makes them interesting. For this and other reasons, our brain “keeps” the story.
But… I’ll make an addendum on that later.
In contrast, in mathematics we deal with numbers. However, you will be able to perceive that these worlds hardly meet.
Storytelling with numbers is becoming a very important skill in the world of data.
Over time, the volume of data has increased along with the complexity of the analyses. This evolution was supported by technological evolution and with it the desire to analyze them.
What simplifies can also make difficult
Currently there are several tools such as the old excel and selfservice BI tools. The bright side is democratizing tasks that were left in the hands of scientists.
And the not so good side? Literally anyone can create visuals, graphics, even if they don’t have expertise in the subject.
The tool makes life simple, but it will only create the visuals. You will create and tell the story.
Data visualization is not just about creating visuals. It is made up of successful communication with your customer. The story you tell will define how your customer will receive and retain the information.
So how do you tell a story with numbers?
What about story with numbers? Storytelling
We will address various techniques and best practices for data visualization throughout other posts, however, we can make some comments on the subject.
How to understand demand?
We need to consider the input to create the story. Therefore, we can check some factors, such as:
- What is the context?
- What is the demand?
- What is the audience the target who will receive the information?
- What is the purpose of the dash?
We will discuss this issue in more detail in the future. Now suppose you have already defined the previous step. What’s next? Assemble the story!
Storytelling Logic
How to create the story from the context?
Now if we are going to think about how to create a story, we can keep in mind other parameters. A story is characterized by a beginning, middle and end (Aristotle and Plato).
However, this was later redefined as: preparation, conflict, and resolution. Let’s understand this idea a little better.
“But… Juliana, how do I put this into practice? In BI for example?” I’m already there! First, let’s understand the 3 acts that make up the story.
Storytelling Creation Steps
The first act, the preparation, we get to know our character, his characteristics and the world around him. The story is brought to a moment of decision. Where he is is a challenge!
At this point the character makes his way to the main point of the story, the climax!
The second act, the conflict, is the part where the character tries to resolve the conflict. He seeks to solve them, but finds himself in a more difficult situation. This point is called the character arc.
At this point, if the character doesn’t have all the tools to overcome the challenge, he will have to find them. Be they any kind of skills.
How can this help you? You’ll be able to convey your results by telling events in a non-linear story that will be absorbed by your audience.
The third and final act, solution, all (or almost) of the story’s problems are resolved. At this point the solution to the problem is put on the table culminating in the resolution of the challenge previously faced by the character.
Comparing facts with stories
Imagine if the Cinderella story were told this way:
- “Cinderella was 18 years old, had two sisters, and was a maid in her stepmother’s house.
- The fairy makes Cinderella a princess at 19:00
- Runningly voted at 00:01 of the Ball
- she married a prince on the 10th of November at 10 am.”& nbsp;
Now imagine the story of Little Red Riding Hood in the same way:
- “Little Riding Hood (CV) walked 3k to reach his grandmother’s house on the 15th.
- The wolf ran ahead and arrived at 10:00.
- The wolf ate the granny and put on her clothes.
- CV entered the house at 11:00.
- CV asked the wolf questions. The wolf eats CV
- The hunter opens the wolf’s belly at 11:10 and takes out the granny and CV.
To paraphrase the Storytelling book that I really like, book:”Storytelling with Data”, “ When we only put the facts, the story is not so interesting!”
The fundamental point of the story lies in the life-changing motive, whether it’s Little Red Riding Hood, Cinderella, or even your company’s KPI.
Translating the story for BI
V Let’s talk about other subjects to compose a correct and complete idea of storytelling. But let’s see this example applied to a simplistic BI scenario.
Scenario: “We had an 8.07% increase in sales of product XYZ compared to the previous month”
How could we tell it in story format?
“Last month we conducted data analysis of our key products and saw untapped potential in product XYZ.
From there we start an offer campaign for that specific product. However, after a week we had no satisfactory result.
Therefore, we observe the need for awareness among our public. So we created a nutrition campaign with our customers to make them aware of the benefits of the product.
The two actions aligned resulted in an 8.07% increase in sales through our website.”
What’s up? Did Storytelling make a difference?
Can you see the difference in this very simple example? Let’s see if all the elements of the story, which we mentioned earlier, are present?
The First Act – Preparation
Our character consists of the person who analyzes sales.
We have product XYZ, as an adjunct, which was identified in a data analysis of the company’s products.
The challenge? Take advantage of the sales potential of this product.
Act Two – Conflict
We are trying to solve the problem of increasing product sales. However, the first approach was not enough.
What new skill did you acquire to solve the problem? The new skill is in creating the customer awareness and nutrition campaign.
Third Act – Solution
The sales increase problem is solved with a rate of 8.07% for product XYZ.
Considerations
Which of these reports is most likely to stick in your customers’ minds? Considering we have a flood of information at all times?
If you like this subject you will be happy to know that we will have a sequel. We have a lot to understand. Some of the topics that will be covered in future posts:
- How to adjust demand according to target audience?
- Any visual (graphic) will do?
- Storytelling Techniques
- What not to do in a dash
All of them and others will be here on the site www.simplificandoredes.com. See you next time!

Juliana Mascarenhas
Data Scientist and Master in Computer Modeling by LNCC.
Computer Engineer
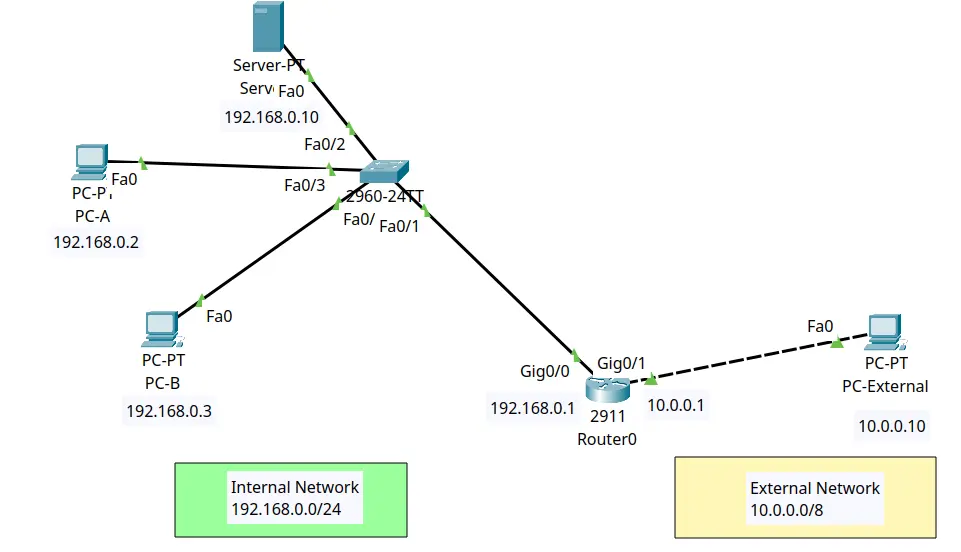
Tutorial: Using Port Forwarding in Packet Tracer

Tutorial: Web Server in Packet Tracer (Client-Server)

Email Server & Webmail Setup: Postfix, Dovecot, SnappyMail
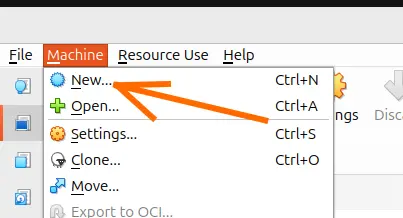
Install Ubuntu Server 26 on VirtualBox (Step-by-Step)

How to Configure NAT in Packet Tracer (Step-by-Step)